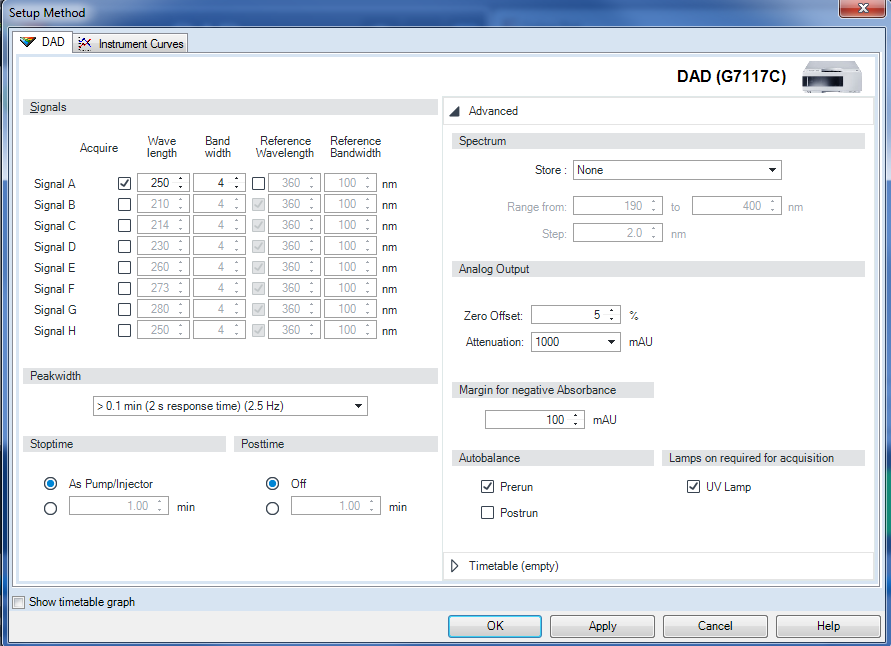
Method Parameter Settings
These settings are available via Menu > Instrument > Set up Instrument Method or via right click into the module’s active area (does not show the Instrument Curves tab).
NOTE
For additional help and support: Highlight the desired cell and press F1. A help screen will open with additional information and documentation about the topic.
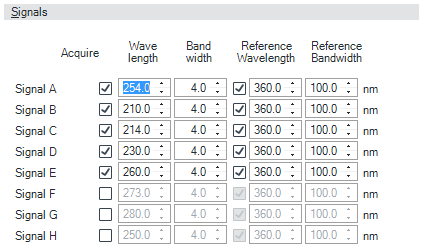
| Signals Up to 8 individual signals can be set. For each of the signals, the wavelength and bandwidth can be set for sample and reference. Limits:
Setting an appropriate reference wavelength could improve the baseline behavior. |
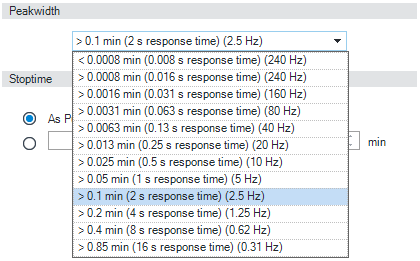
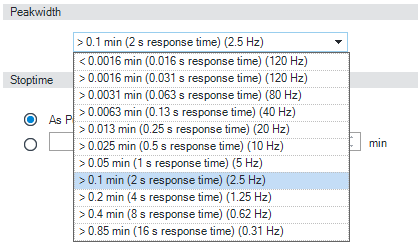
G7117B Peakwidth Settings
G7117A/C Peakwidth Settings | Peakwidth (Responsetime, Data Rate) Peakwidth enables you to select the peak width (response time) for your analysis. The peak width is defined as the width of a peak, in minutes, at half the peak height. Set the peak width to the narrowest expected peak in your chromatogram. The peak width sets the optimum response time for your detector. The peak detector ignores any peaks that are considerably narrower, or wider, than the peak width setting. The response time is the time between 10 % and 90 % of the output signal in response to an input step function. When the All spectrum storage option is selected, then spectra are acquired continuously depending on the setting of the peak width. The time specified by the peak width is used as a factor in the acquisition of spectra. The acquisition time for one spectrum is slightly less than the peak width divided by 8 , which is the acquisition time. Limits: When you set the peak width (in minutes), the corresponding response time is set automatically and the appropriate data rate for signal and spectra acquisition is selected. Do not use peak width shorter than necessary. G7117A: Do not use 0.025 s response time (no filtering/high noise and no need (actually ultra-fast LC doesn't deliver peaks <0.0025 min/<0.15 s).
For details see Peak Width (Response Time). |
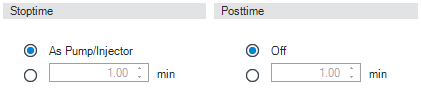
| Stoptime/Posttime The stoptime is the time where either the complete system stops (As Pump/Injector) or the module (if different from system stop time). The data collection is stopped at this time. A posttime period can be used to allow module’s items to equilibrate (e.g. after gradient change or temperature change). |
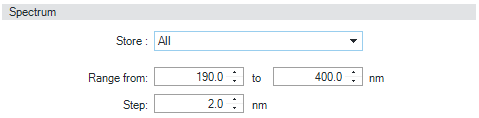
| Spectrum Settings
|
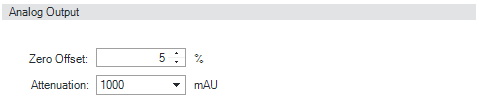
| Analog Output The range can be set to either 100 mV or 1 V full scale, see Detector Control Settings.
|
| Margin for negative Absorbance Use this field to modify the detector’s signal handling to increase the margin for negative absorbance. Use this option if, for example, your solvent gradient produces a decreasing baseline absorbance, and for GPC analyses. Limits: 100 to 4000 mAU. The higher the value the greater the baseline noise. Set this value only if you expect negative absorbance greater than -100 mAU. Slitwidth (G7117B): You can select the optical bandwidth (1, 2, 4 or 8 nm) of the detector; the narrower the slit, the smaller the optical bandwidth of the instrument, but the lower its sensitivity. The smaller the optical bandwidth the higher the spectral resolution. Slitwidth The G7117A and G7117C have a fixed slit width of 4 nm. |
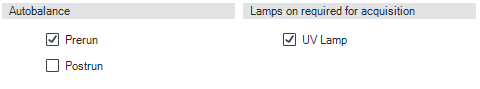
| Autobalance Defines, whether a balance is performed prior to a run and/or after a run has finished. Lamp on required for acquisition: If unchecked, the lamp will be turned off after the analysis has finished. Note that the lamp on requires at least one hour warm-up time, see Warm up of the Detector. |
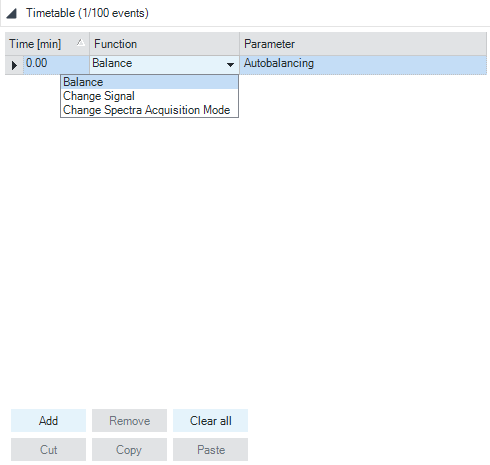
| Timetable You may set up time events to change functions with their parameters over the run time. Add lines as required. Time Limits: 0.00 to 99999.00 min in steps of 0.01 min. Via the buttons in the bottom area, time table lines can be added, removed, cut copied, pasted or completely cleared. Based on the chosen function, a certain parameter can be selected. |
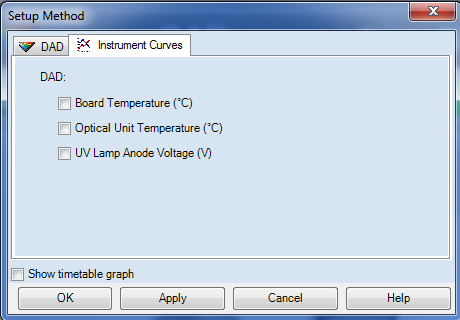
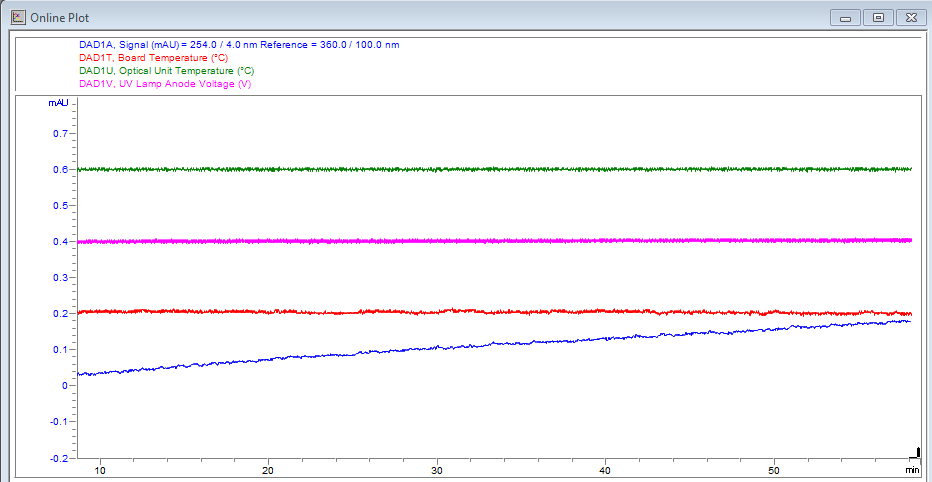
| Instrument Curves The detector has several signals (internal temperatures, voltages of lamps) that can be used for diagnosing problems. These can be baseline problems deriving from deuterium lamps wander / drift problems due to temperature changes. These signals can be used in addition to the normal baseline signal to determine whether correlation to temperature or voltage/current of the lamp. These signals are available via the Agilent ChemStation Online Plot/Data Signal and/or Agilent Lab Advisor Software. |

base-id: 3526965387
id: 9007202781706379