How to Achieve Higher Sensitivity
The detector has a number of parameters that are used to optimize performance. The following sections describe how the detector parameters affect performance characteristics:
Flow cell affects sensitivity,
Wavelength and bandwidth affect sensitivity, selectivity and linearity,
Slit width affects sensitivity, spectral resolution and linearity,
Peak width affects sensitivity and resolution.
Flow Cell
The Max-Light cartridge flow cell has a standard 10 mm path length and is optimized for minimal volume and dispersion (σ volume 1.0 µL). It has high light transmission minimizing noise to reduce noise due to the optofluidic waveguide. It is suitable for use with a wide range of analytical columns from short narrow-bore columns to long standard diameter (4.6 mm) columns. Generally the peak dispersion volume (calculated from peak width x flow rate) should be greater than about 2 µL for this cell (for example 0.02 min x 200 µL/min = 4 µL).
The Max-Light high sensitivity cell has a path length of 60 mm and this will give between three and five times increase in signal-to-noise values depending on the application conditions. The dispersion volume is fractionally increased compared to the standard cell.
Wavelength and Bandwidth
The detector measures absorbance simultaneously at wavelengths from 190 nm to 640 nm using diode-array detection. A UV-lamp provides good sensitivity over the whole wavelength range. The diode-array detector (DAD) can simultaneously compute and send to the data system up to eight chromatographic signals and the full-range spectra at every time point.
A UV chromatogram or signal is a plot of absorbance data versus time and is defined by its wavelength and bandwidth.
The wavelength indicates the center of the detection band.
The bandwidth defines the wavelength range over which the absorbance values are averaged to give the result at each time point.
For example, a signal at wavelength 250 nm with a bandwidth of 16 nm will be an average of the absorbance data from 242 nm to 258 nm. Additionally, a reference wavelength and reference bandwidth can be defined for each signal. The average absorbance from the reference bandwidth centered on the reference wavelength will be subtracted from its equivalent value at the signal wavelength to produce the output chromatogram.
The signal wavelength and bandwidth can be chosen so that they are optimized for:
Broad band universal detection
Narrow band selective detection
Sensitivity for a specific analyte.
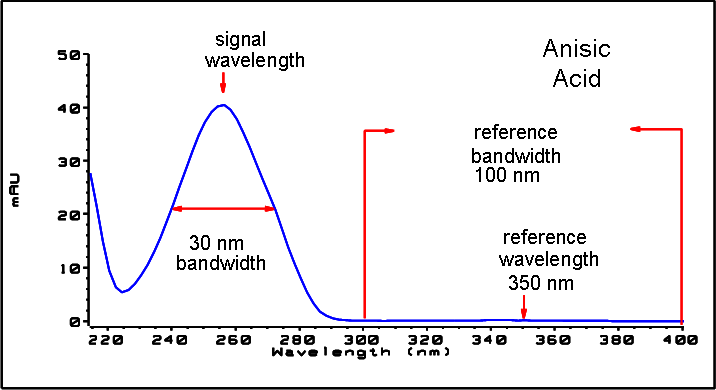
Broad band or universal detection works by having a wide bandwidth to detect any species with absorbance in that range. For example, to detect all absorbing molecules between 200 nm and 300 nm set a signal at 250 nm with a bandwidth of 100 nm. The disadvantage is that sensitivity will not be optimal for any one of those molecules. Narrow band or selective detection is used most often. The UV spectrum for a particular molecule is examined and an appropriate absorbance maximum is selected. If possible, the range where solvents absorb strongly should be avoided (below 220 nm for methanol, below 210 nm for acetonitrile). For example, in Spectrum of Anisic Acid, anisic acid has a suitable absorbance maximum at 252 nm. A narrow bandwidth of 4 nm to 12 nm generally gives good sensitivity and is specific for absorbance in a narrow range.
The narrow band can be optimized for sensitivity for a specific molecule. As the bandwidth is increased the signal is reduced but so is the noise and there will be an optimum for best S/N. As an approximate guide, this optimum is often close to the natural bandwidth at half-height of the absorption band in the UV spectrum. In the anisic acid example this is 30 nm.
The analytical wavelength is usually set at a wavelength maximum to increase sensitivity to that molecule. The detector is linear up to 2 AU and beyond for many applications. This offers a wide linear range for concentration. For high concentration analysis the concentration linear range can be extended by setting the wavelength to one with a lower absorbance such as a wavelength minimum or by taking a wider bandwidth which usually includes lower absorbance values. The use of wavelength maxima and minima for quantitation dates back to conventional UV detectors which because of mechanical tolerances in moving gratings needed to avoid steeply sloping parts of the spectrum. Diode-array based detectors do not have this limitation but for reasons of convention maxima and minima are chosen in preference to other parts of the spectrum.
The reference bandwidth is normally set on a region of the UV spectrum in which the analyte has no absorbance. This is shown in the spectrum for anisic acid in Spectrum of Anisic Acid. This spectrum is typical of many small molecules containing a UV chromophore. For best results the reference has been set so that it is a wide band as close to the signal wavelength as possible but on a zero absorbance region. Reference bandwidths of 60 nm to 100 nm are commonly used. The default reference is 360 nm with a bandwidth of 100 nm. A wide bandwidth is used because this reduces the noise in the reference signal (from statistical theory, the error, i.e. noise in this case, is reduced by the square root of the number of determinations). It is important that the reference bandwidth does not extend to a part of the spectrum that has some absorbance as this would then reduce the resulting signal and sensitivity would be reduced. The use of a reference wavelength can help to reduce drift or wander in the chromatogram caused by refractive index changes due to room temperature fluctuation or gradient operation. The effect of a reference signal can be easily tested by setting two otherwise identical signals, one with and one without a reference signal. If there is no part of the spectrum with zero absorbance then it will be better to have the reference signal turned off.
Peak Width, Response Time and Data Collection Rate
The peak width setting, response time and data rate in the detector are all linked. The available settings are shown in Peak Width — Response Time — Data Rate (G7115A/G7165A). It is important to set this correctly for optimum sensitivity and to preserve the resolution achieved in the separation.
The detector internally acquires data points faster than is needed for a chromatogram and processes them to produce the signal seen by the data system. Part of the processing reduces the data to an appropriate data rate which allows the chromatographic peaks to be accurately drawn. As with most analytical determinations groups of readings are effectively averaged to reduce error in the result. The detector bunches raw data points and produces the output signal data at the required data collection rate by an electronic filtering process. If the resulting data rate is too slow (over filtering) the peak heights will be reduced and the resolution between them reduced; too fast and the data is noisier than it need be to accurately profile narrow peaks.
The peak width setting in the detector allows the user to correctly set these parameters without needing any knowledge other than sight of the chromatogram integration results to see how wide the peaks are. The peak width setting should be set for the narrowest peak width observed in the chromatogram. If it is set too wide it will make the peaks appear lower in height and wider (and potentially less resolved) and if it is set too narrow it will increase the baseline noise unnecessarily. Essentially the software uses this value to set the data collection rate such that it collects enough data points over the narrowest peaks and it is aiming for 15 to 25 points across a peak. The DAD can collect at a maximum up to 120 Hz if required which would allow enough data points to be collected over a peak that is only 0.1 s wide. The response time setting is another way of indicating how this filtering is set. It is measured in seconds and is about one-third of the peak width value (which is measured in minutes). It effectively shows how quickly the plotted signal responds to a step change in the input signal.
NOTE
The full spectra is not available under all conditions.
Based on the data points, the scan data rate is reduced, see Peak Width — Response Time — Data Rate (G7115A/G7165A).
| Peak width at half height [min]Values in the user interface may be rounded | Response [s] | Scan data rate[Hz] ≤ 251 pts/scan | Scan data rate[Hz] ≤ 501 pts/scan | Scan data rate[Hz] > 501 pts/scan |
|---|---|---|---|---|---|
< 0.0015625 | 0.015625 | 120 | 120 | 40 | 20 |
> 0.0015625 | 0.03125 | 120 | 120 | 40 | 20 |
> 0.003125 | 0.0625 | 80 | 80 | 40 | 20 |
> 0.00625 | 0.125 | 40 | 40 | 40 | 20 |
> 0.0125 | 0.25 | 20 | 20 | 20 | 20 |
> 0.025 | 0.5 | 10 | 10 | 10 | 10 |
> 0.05 | 1 | 5 | 5 | 5 | 5 |
> 0.1 | 2 | 2.5 | 2.5 | 2.5 | 2.5 |
> 0.2 | 4 | 1.25 | 1.25 | 1.25 | 1.25 |
> 0.4 | 8 | 0.625 | 0.625 | 0.625 | 0.625 |
> 0.85 | 16 | 0.3125 | 0.3125 | 0.3125 | 0.3125 |
[1]Values in the user interface may be rounded
NOTE
The maximum spectra scan rate depends on the data points per scan, see Peak Width — Response Time — Data Rate (G7115A/G7165A).
base-id: 3358209035
id: 3358209035