Match the Flow Cell to the Column
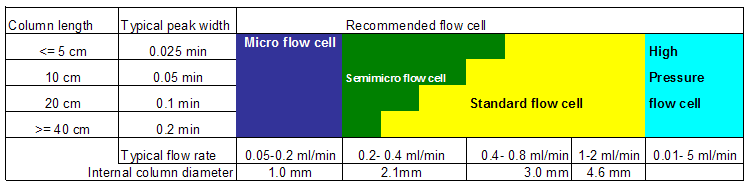
The tables below recommend the flow cell that matches the column used. If more than one selection is appropriate, use the larger flow cell to get the best detection limit. Use the smaller flow cell for best peak resolution.
Standard HPLC Applications
Ultra Fast Separation With RRLC Systems
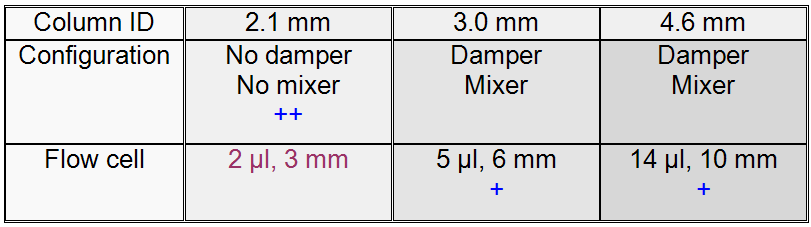
(+) For ultra fast analysis with step gradients the micro flow cell (2 µL, 3 mm) gives the best performance
(++) In high resolution analysis time is not the highest priority. Higher delay volumes are accepted. Therefore we recommend to use the damper plus mixer for a highest signal to noise.
If longer columns (> 50 mm) for higher resolution are used, then the next larger flow cell is the preferred choice for higher sensitivity.
Flow Cell Path Length
Lambert-Beer’s law shows a linear relationship between the flow cell path length and absorbance.

where
T | is the transmission, defined as the quotient of the intensity of the transmitted light I divided by the intensity of the incident light, I₀, |
e | is the extinction coefficient, which is a characteristic of a given substance under a precisely-defined set of conditions of wavelength, solvent, temperature and other parameters, |
C [mol/L] | is the concentration of the absorbing species, |
d [m] | is the path length of the cell used for the measurement. |
Therefore, flow cells with longer path lengths yield higher signals. Although noise usually increases little with increasing path length, there is a gain in the signal-to-noise ratio. For example, in Influence of Cell Path Length on Signal Height the noise increased by less than 10 % but a 70 % increase in signal intensity was achieved by increasing the path length from 6 mm to 10 mm.
When increasing the path length, the cell volume usually increases — in the example from 5 – 14 µL. Typically, this causes more peak dispersion. As demonstrated, this did not affect the resolution in the gradient separation in the example that is shown below.
As a rule-of-thumb, the flow cell volume should be about 1/3 of the peak volume at half height. To determine the volume of your peaks, take the peak width as reported in the integration results multiply it by the flow rate and divide it by 3).
Traditionally LC analysis with UV detectors is based on comparing measurements with internal or external standards. To check photometric accuracy of the detector, it is necessary to have more precise information on path lengths of the flow cells.
The correct response is:
expected response * correction factor
Please find below the details of the flow cells:
Part number | Path length (actual) | Correction factor |
|---|---|---|
G1314-60186 (Standard flow cell 10 mm, 14 µL, 40 bar) | 10.15 ± 0.19 mm | 10/10.15 |
G1314-60183 (Semi-micro flow cell 6 mm, 5 µL) | 6.10 ± 0.19 mm | 6/6.10 |
G1314-60187 (Micro flow cell 3 mm, 2 µL, 120 bar) | 2.80 ± 0.19 mm | 3/2.8 |
G1314-60182 (High pressure flow cell 10 mm, 14 µL, 400 bar) | 10.00 ± 0.19 mm | 10/10 |
G1314-60188 (Bio standard flow cell VWD, 10 mm, Cell Vol. 14 µl, Sapphire, MP35N) | 10.15 ± 0.19 mm | 10/10.15 |
G1314-60189 (Bio micro flow cell VWD, 3 mm, Cell Vol. 2 µl, Sapphire, MP35N) | 2.80 ± 0.19 mm | 3/2.8 |
NOTE
However you have to be aware that there is additional tolerance of gasket thickness and its compression ratio which is supposed to be very small in comparison with the machining tolerance.
base-id: 3283631115
id: 3283631115